
Hormuz Crisis 2026: European Jet Fuel Supply Challenges & Airline Impacts – Special Report - 22 March 2026
Headlines are screaming aviation fuel apocalypse — but our own independent analysis at Boston Warwick shows the situation is far less dire than the panic suggests.
With the IEA’s record 400-million-barrel release already flowing, in-transit oil volumes running 50% above normal for this time of year, and airlines able to trim non-essential flying if prices stay high, European carriers actually have meaningful breathing room.
We’ve cut through the noise with clear, data-backed timelines, country-specific impacts, and real-world implications. Dive in — the full picture is more hopeful (and more actionable) than most coverage is telling you.
1. Overall Situation (Iran Conflict – March 2026)
President Trump’s 48-hour ultimatum to Iran has triggered full closure of the Strait of Hormuz — the chokepoint carrying 20% of global oil and 30–45% of Europe’s jet fuel supply. US-Israeli strikes have led to airspace closures across the Gulf, tanker disruptions, and immediate rerouting of flights. Jet fuel prices have hit multi-year records (NW Europe physical >$1,000/t, Singapore crack >$100/bbl, regrade to diesel >$20/bbl). Up to 50% of European jet supply is at risk because roughly half of EU jet imports transit the Hormuz chokepoint (Kuwait’s Al-Zour complex is a key origin). No immediate EU-wide oil/gas crisis has been declared, but aviation fuel is the most exposed refined product. The IEA triggered its largest-ever coordinated release of ~400 million barrels on 11 March 2026, with phased European deliveries now underway.
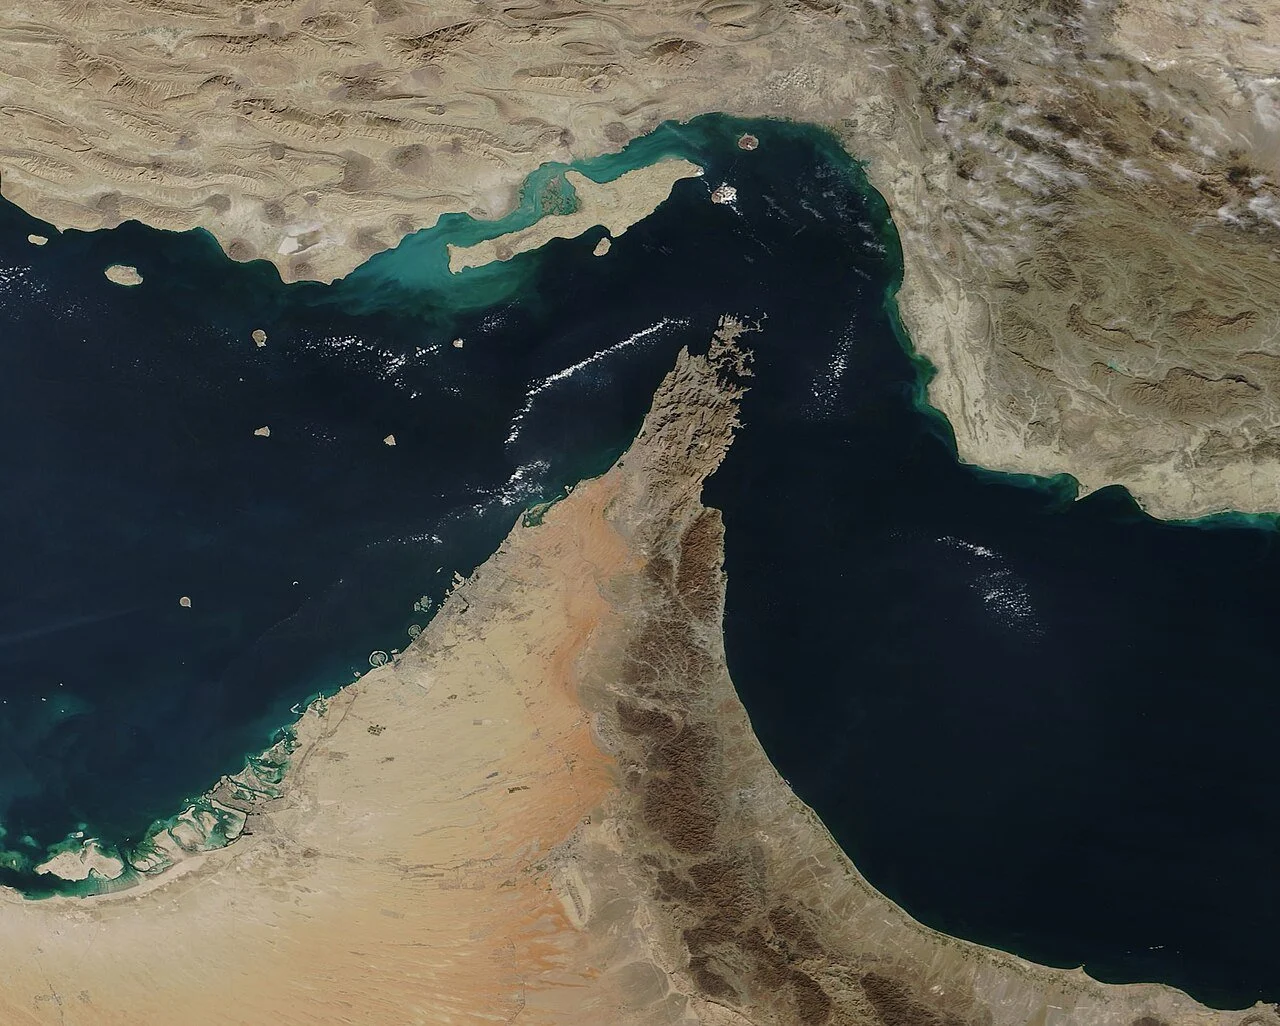
Strait of Hormuz
The narrow straight is the pinchpoint that flows between the Persian Gulf and the Gulf of Oman.
2. European Jet Fuel Dependence
Europe is dangerously exposed. The continent has become a structural net importer of jet fuel, relying on overseas sources for 30–50% of its supply — and close to half when Middle East Gulf volumes passing through the Strait of Hormuz are factored in.
At the same time, its domestic refining industry has been gutted. Four major refineries closed in 2025 alone, erasing 400,000 barrels per day of capacity. When combined with earlier losses since 2020, Europe has shed more than 1.2 million barrels per day of refining power. Plants such as Grangemouth in the UK, Livorno in Italy, and Germany’s Wesseling and Gelsenkirchen facilities have all fallen silent.
Yet jet fuel demand continues to rise — the only refined product still growing at 3–4% year-on-year according to Eurocontrol data.
The result is a perfect storm. With the Hormuz route now blocked, millions of barrels of critical imported jet fuel are currently trapped in the Gulf, leaving European airlines acutely vulnerable to shortages and record prices.
View Our Presentation, Hormuz Crisis 2026: Jet Fuel Shockwaves Across Europe
3. Stockpiles, Strategic Reserves & Consumption Rates
Despite the headlines, Europe is not flying blind. While detailed country-by-country jet fuel stock figures are not published in real time — unlike the transparent weekly updates from the US Energy Information Administration — the broader picture is more reassuring than many reports suggest.
Most jet fuel is held in commercial inventories, backed up by government strategic reserves maintained under the IEA’s mandatory 90-day net-import obligation. On 4 March 2026, the European Commission confirmed that overall petroleum stock levels remain high, with no immediate security-of-supply risks. Importantly, the IEA’s record release of 400 million barrels is already flowing into the market.
Key reference points include:
Jet fuel inventories at the vital ARA hub (Rotterdam, Antwerp and Amsterdam) are running slightly above seasonal norms, at around 0.8–1.0 million tonnes (5.8–7.3 million barrels).
Overall EU emergency petroleum stocks provide cover for 90 days of net imports (covering both crude and finished products).
Volumes of middle distillates already in transit, including jet fuel, are 50% higher than normal for this time of year — creating a valuable short-term buffer of several weeks.
That said, high-consumption countries will feel the pressure first if the disruption drags on. Rerouting flights around the blocked Strait will also increase daily fuel burn by 5–15% on long-haul Asia-Europe routes.

Fewer Refineries
Europe continues to decommission many oil refineries including the UK’s decision to close Grangemouth in 2025.
4. Jet Fuel Stockpiles, Consumption, & Crisis Timelines (Publicly Derived Estimates)
While headlines scream of an imminent fuel apocalypse, the numbers tell a more measured story. Boston Warwick has modelled realistic, conservative timelines for how long European jet fuel supplies can actually last under a sustained Hormuz closure.
These projections draw solely from public IEA and EU data, commercial ARA hub reports, tanker tracking from Kpler and Vortexa, and lessons from past Middle East disruptions. Importantly, they already bake in two powerful buffers: the IEA’s record 400-million-barrel emergency release, which is actively flowing into European markets right now, and the unusually high volumes of middle distillates already at sea — 50% above normal for this time of year.
The table below breaks it down country by country. “Est. Days to Crisis Declaration” shows when local shortages could start forcing rationing discussions or emergency measures. “Est. Days to Strategic Reserve Release Threshold” marks the point at which governments would normally tap strategic stocks — a line that has already been crossed thanks to the IEA’s coordinated action now underway.
Jet Fuel Stockpiles & Planned Consumption – Major European Markets (public EIA/IndexMundi/Eurocontrol-derived averages, kb/d = thousand barrels per day)
| Country | Daily Consumption (kb/d) | Import Reliance & Vulnerability | Stockpile / Cover Context (public) | Est. Days to Crisis Declaration (Hormuz closed, no full backfill) | Est. Days to Strategic Reserve Release Threshold (IEA now flowing) | Est. Days Extension with 10% Demand Drop |
|---|---|---|---|---|---|---|
| United Kingdom | 240–242 | Very High (ME Gulf + US) | ARA-linked + industry stocks | 25–30 days | 55–65 days (extended by IEA) | +3–5 days |
| Germany | 187–196 | High (Frankfurt/Munich) | IEA pool + CEPS pipeline | 30–35 days | 60–70 days (extended by IEA) | +3–6 days |
| France | 143–146 | High (CDG/Orly) | SAGESS national reserves incl. jet | 32–38 days | 65–75 days (extended by IEA) | +3–6 days |
| Spain | 114–120 | Medium-High | Mediterranean ports | 35–40 days | 70–80 days (extended by IEA) | +4–7 days |
| Italy | 80–82 | High (Milan) | Limited local + CEPS partial | 28–33 days | 55–65 days (extended by IEA) | +3–5 days |
| Netherlands | 70–72 | Very High (Schiphol/ARA hub) | ARA stocks direct | 30–35 days (hub effect) | 60–70 days (extended by IEA) | +3–5 days |
| EU Total (est.) | 1,000–1,300 | 30–50% imported (45% ME) | 90-day IEA obligation overall | 28–35 days average | 60–75 days average (extended by IEA) | +3–6 days average |
Key takeaway: The UK faces the tightest timeline due to volume and exposure. In-transit buffer (50%+ above normal) adds 10–15 days region-wide initially. The IEA’s 400-million-barrel release is now delivering physical barrels, buying critical extra weeks.
Aviation Fuel Priority Ranking When Reserves Are Released
Even when governments and the IEA start releasing barrels from strategic reserves, civil aviation sits close to the bottom of the priority list.
Across most European countries, emergency fuel allocation plans follow a clear hierarchy:
Road transport and essential diesel supplies
Heating and power generation
Military and critical national infrastructure
Civil aviation typically ranks 4th or 5th — the lowest priority among major civil sectors.
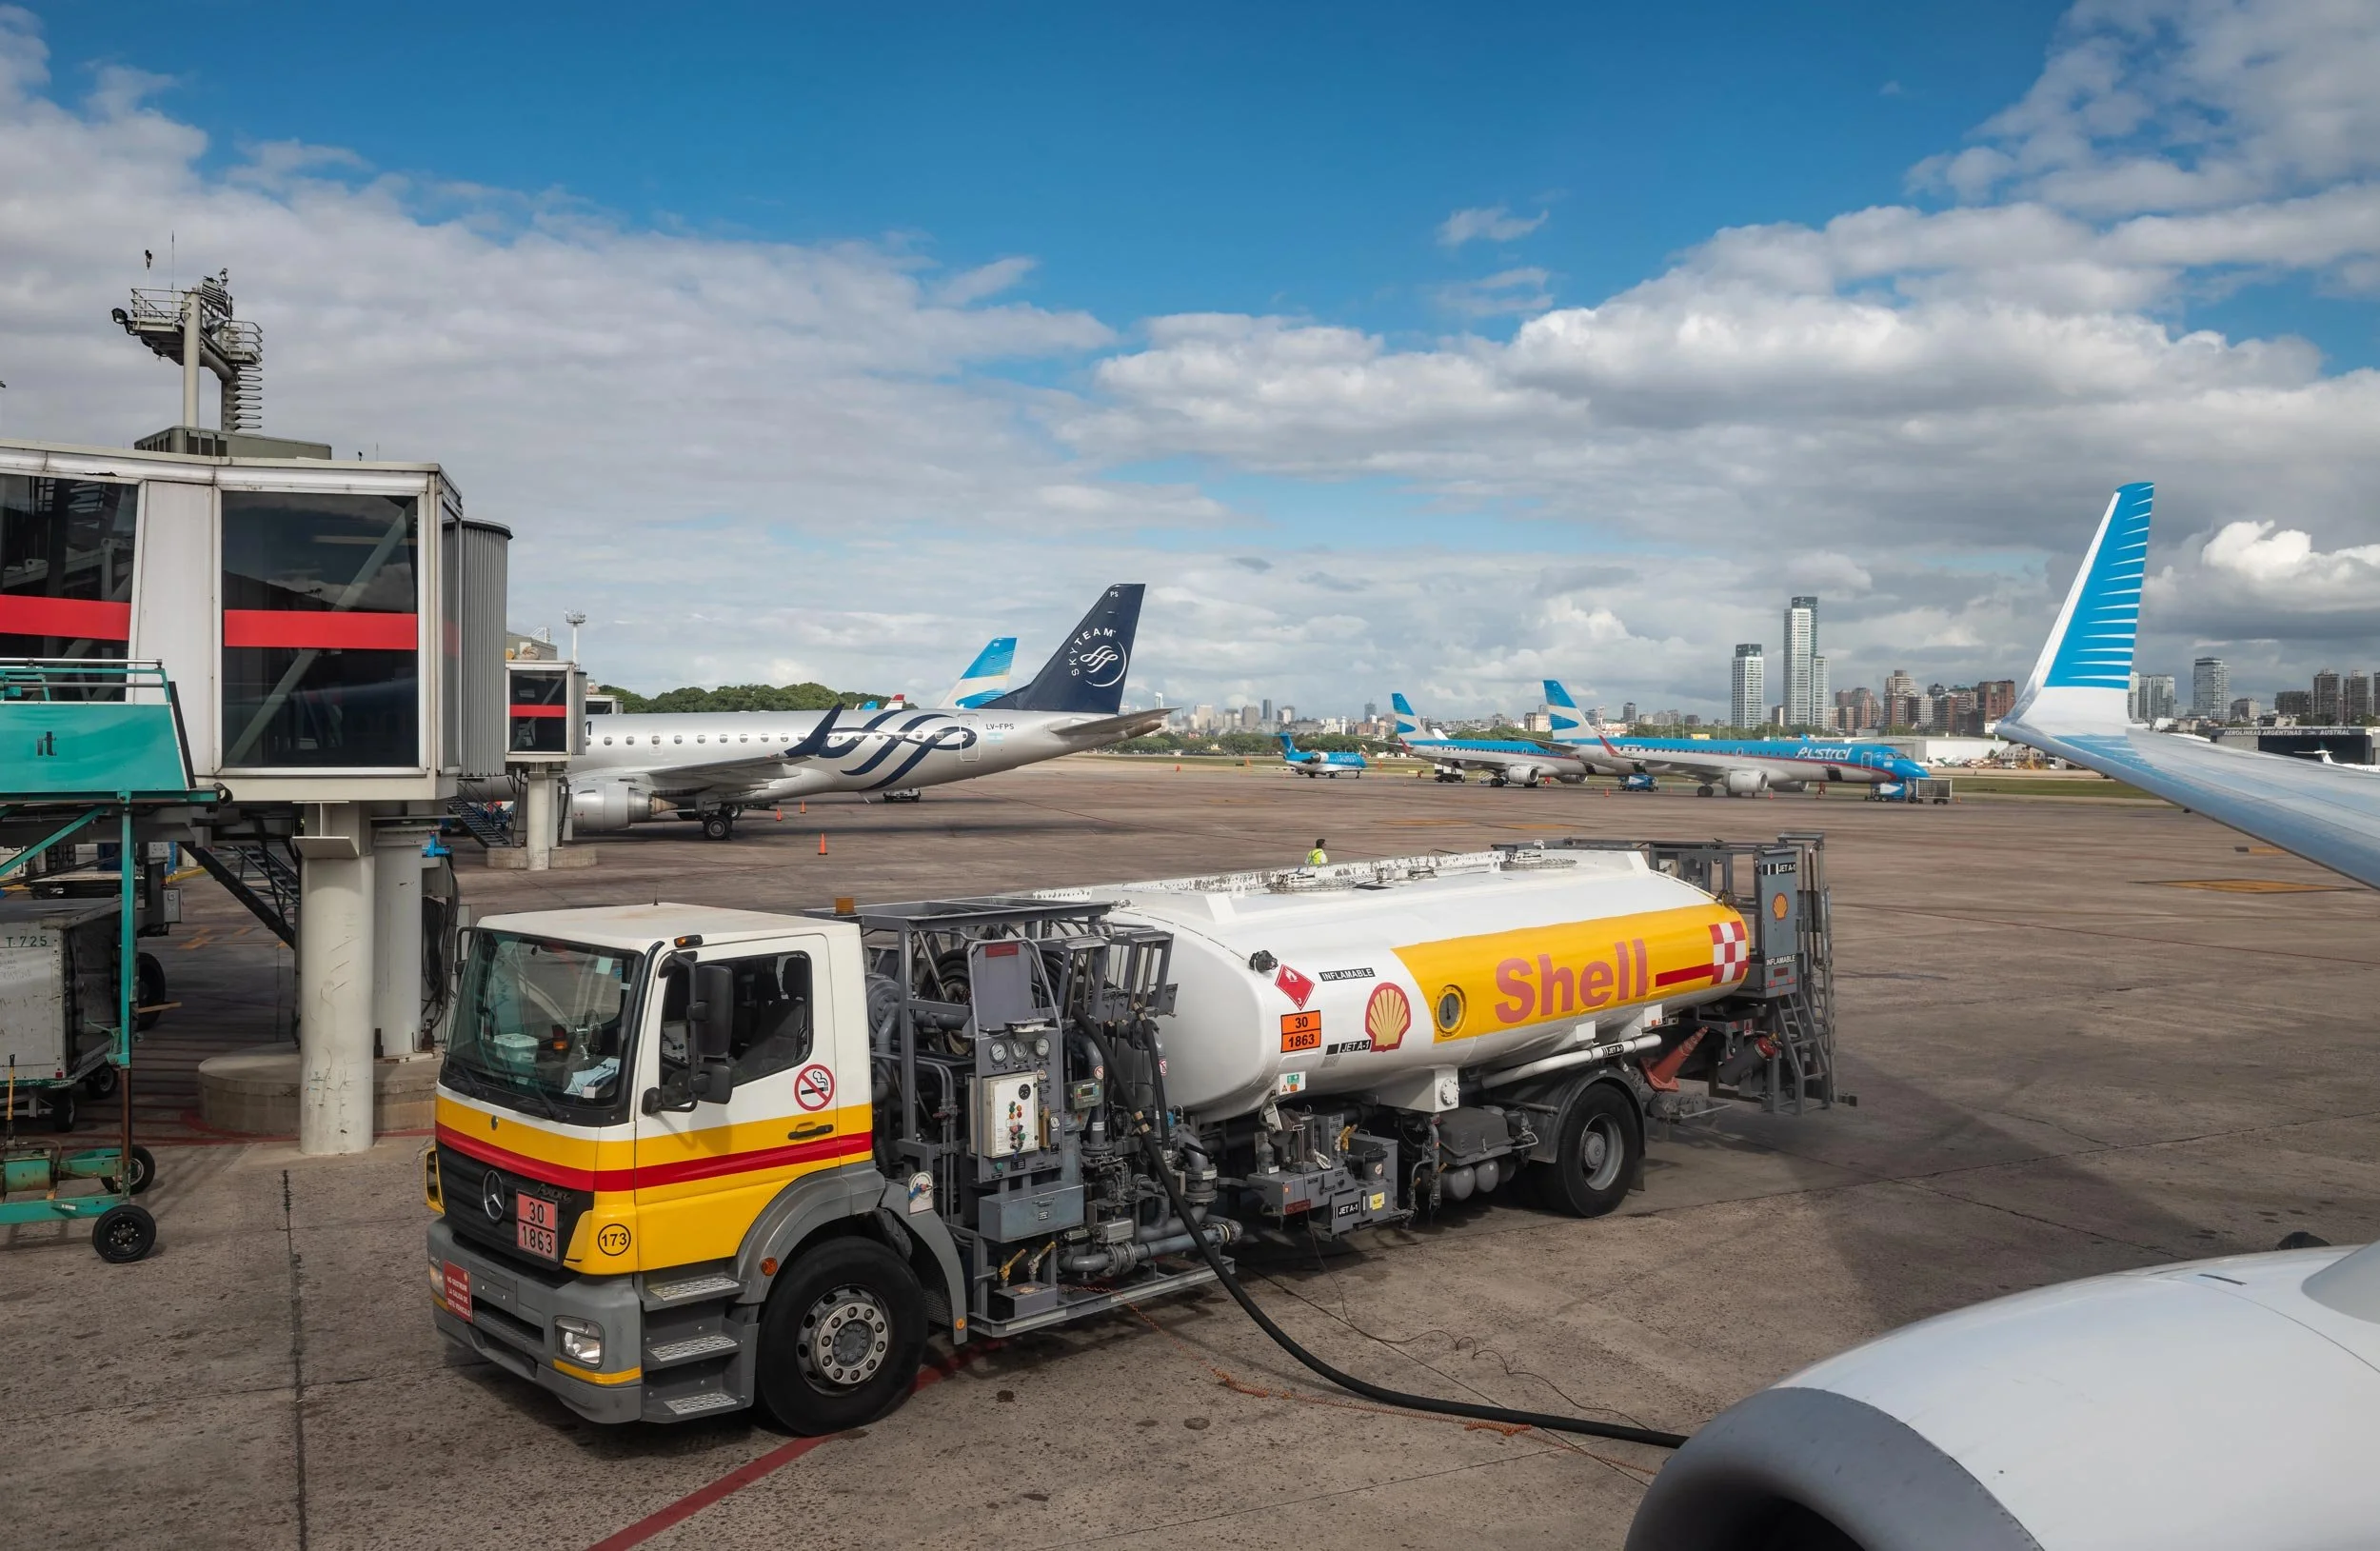
With jet fuel already the scarcest product on the market, the IEA has urged member states to introduce immediate demand-reduction measures, including cuts to non-essential flying. Airlines are responding by lobbying Brussels to delay the next round of sustainable aviation fuel mandates while rapidly rolling out new fuel surcharges. Should the crisis drag on beyond 60 days, far more severe restrictions on air travel would almost certainly follow.
Aviation Optional?
Despite aviation being seen as economically beneficial to link countries, in times of crisis flying will be deprioritized by governments.
5. Airline Passenger Demand Outlook
The surge in jet fuel prices is already translating into higher ticket costs for passengers, and the first clear signs of softening demand are rippling across European carriers.
Major airlines have begun openly flagging imminent fare increases as they scramble to pass on the extra fuel burden. At the same time, the safety fears and geopolitical uncertainty triggered by the Iran conflict are weighing heavily on traveller confidence. In the opening days alone, global airline stocks tumbled sharply and thousands of flights were cancelled or rerouted as carriers scrambled to avoid the closed Gulf airspace.
The hardest hit routes are those heading east. With large swathes of Middle Eastern airspace now off-limits and the Strait of Hormuz blocked, airlines are forced into lengthy detours. Analysts expect short-term demand on Europe-to-Asia and Europe-to-Middle East services to fall by 15–25% — a pattern that closely mirrors the sharp drops seen during the Gulf Wars of 1990–91 and 2003.
Visual: Projected Short-Term Demand Drop by Route Type (Hormuz Crisis 2026)
The chart below shows Boston Warwick’s assessment of how hard different route categories are expected to be hit in the coming weeks. Eastbound services are clearly the most exposed.
Projected Short-Term Demand Drop by Route Type
(15–25% on eastbound routes = sharpest impact; overall network milder at 5–15%)
6. Implications for Airlines & Aviation Stakeholders
The Hormuz crisis is no longer a distant geopolitical headline — it is now a live operational and financial pressure test for every European carrier, airport operator, and fuel buyer.
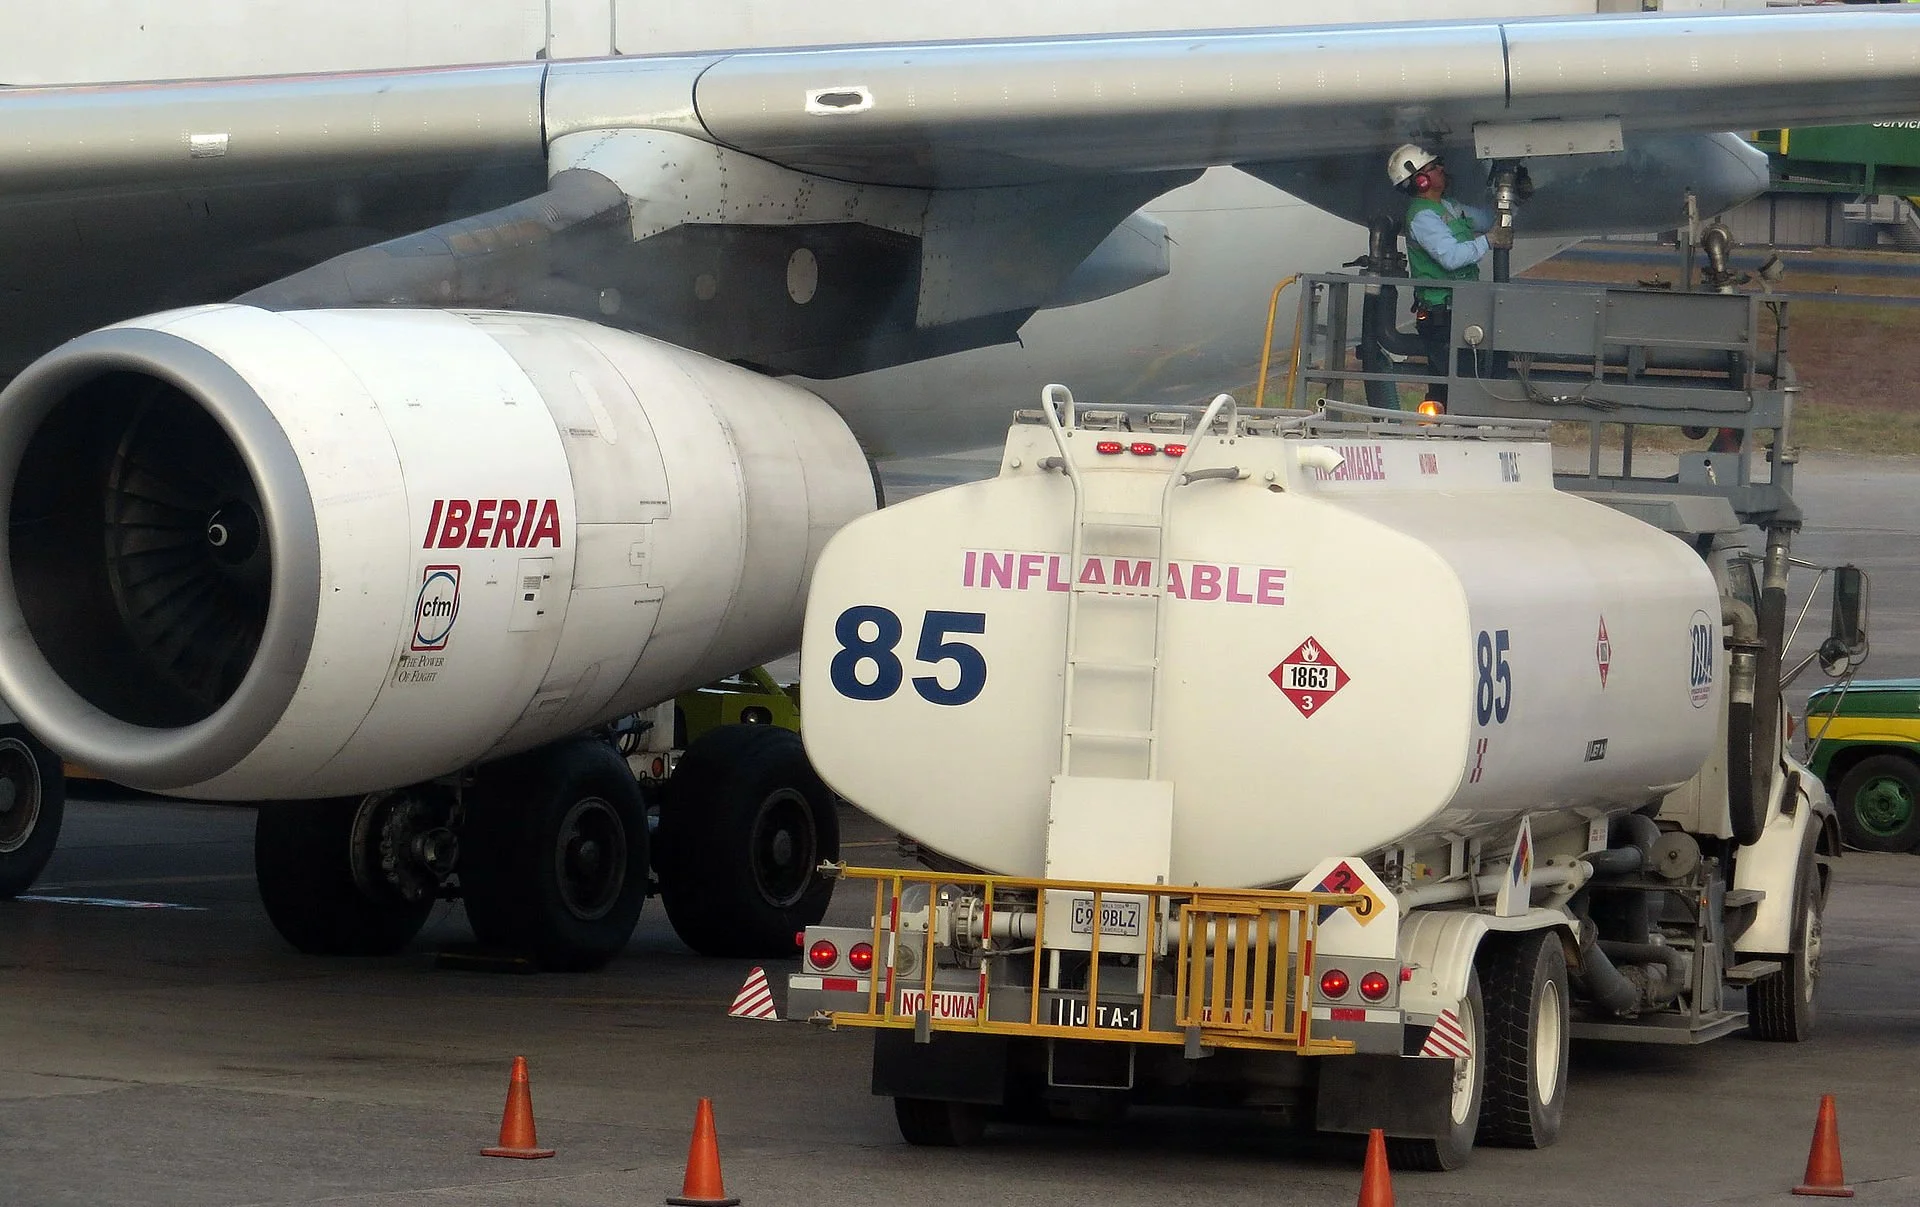
Fuel costs, already the single biggest expense for most airlines, are spiking at the worst possible moment. Carriers face a triple hit: record jet-fuel prices, longer rerouted flight times that burn 5–15% more kerosene, and the very real prospect of having to pay premium spot-market rates for any additional cargoes. Those without strong hedges in place are already scrambling to implement emergency surcharges, while low-cost carriers are quietly trimming marginal routes and reducing frequencies.
The knock-on effects are immediate. Fleet planners must now revisit utilisation forecasts and potentially accelerate the retirement of older, thirstier aircraft. M&A teams are re-running valuation models because higher sustained fuel prices can wipe tens of millions off the enterprise value of smaller leisure operators. Airport operators at secondary hubs are bracing for lower slot utilisation as long-haul eastbound services are cut or diverted.
Yet the crisis also creates strategic opportunities for those who act decisively. Airlines with strong balance sheets can lock in advantageous fuel contracts or accelerate sustainable aviation fuel partnerships to secure priority allocation. Airports with on-site storage or pipeline access suddenly hold a competitive edge. And for investors, the current volatility is sharpening the difference between resilient, well-hedged carriers and those that will struggle in the months ahead.
This is precisely where Boston Warwick’s expertise in crisis scenario planning, fuel-risk modelling, fleet valuations, and M&A advisory becomes mission-critical. The next few weeks will separate the prepared from the exposed.
7. Primary Public Sources for Passenger Demand Tracking
To stay ahead of the demand shifts this crisis will trigger, aviation professionals need reliable, real-time data rather than yesterday’s headlines. Fortunately, several authoritative public sources are releasing fresh figures almost daily.
IATA (International Air Transport Association) remains the gold standard for passenger demand. Its monthly Revenue Passenger Kilometres (RPK) data measures actual passengers carried multiplied by distance flown and is released early each month. The latest January 2026 figures showed European carriers still posting +6.3% growth year-on-year — but the February and March releases will reveal the first clear signs of softening on eastbound routes. Free press releases are available at iata.org; detailed datasets can be accessed via their market-data portal.
ACI EUROPE (Airports Council International) delivers granular airport-level traffic numbers every month. The January 2026 report showed +4.6% overall growth, but its forthcoming March update is expected to flag the sharpest drops at hubs serving Asia and the Middle East. The free monthly press releases and breakdowns (including non-EU international traffic) are published at aci-europe.org and give the clearest early warning of which airports will feel the pain first.
EUROCONTROL provides the most timely indicator of all through its daily and weekly network traffic dashboards. Flight counts are a near-perfect real-time proxy for demand because cancellations and frequency cuts show up immediately. The latest weekly overview (Week 7 2026) still showed modest growth before the full impact of Gulf airspace closures hit; the next few releases will be watched closely for the scale of reductions. The public dashboard at eurocontrol.int is updated every day and is essential reading for anyone managing network planning or slot portfolios.
Eurostat offers the official EU-wide picture, though with a slight lag. Its monthly air passenger transport statistics break down intra-EU, extra-EU and domestic traffic and provide the authoritative benchmark for longer-term trend analysis.
Supplementary real-time proxies such as Flightradar24’s public statistics pages and the weekly investor updates from Ryanair, easyJet, IAG and Lufthansa Group round out the picture. These often give the first anecdotal hints of what the bigger organisations will report later.
Together, these sources allow airlines, airports and investors to track the crisis’s impact in near real time — turning uncertainty into actionable intelligence.
Sources and Data Disclaimer
All information, analysis, figures, estimates, timelines, and commentary contained in this document are derived exclusively from publicly available sources as of 22 March 2026. No proprietary, confidential, or non-public data has been used or referenced.
Key public sources include (but are not limited to):
Argus Media, S&P Global Platts, Reuters, Bloomberg, Financial Times
International Air Transport Association (IATA) monthly passenger and fuel reports • Airports Council International Europe (ACI EUROPE) airport traffic statistics
EUROCONTROL daily, weekly, and monthly network operations data
International Energy Agency (IEA) emergency stock obligations and market commentary
European Commission and national government statements on petroleum supply security
Kpler, Vortexa, and Insights Global tanker tracking and in-transit cargo estimates
Eurostat air transport statistics • Public airline investor relations releases and traffic updates (e.g., Ryanair, easyJet, IAG, Lufthansa Group)
U.S. Energy Information Administration (EIA) and equivalent international refining/capacity reports
Open-source flight tracking platforms (e.g., Flightradar24 public statistics)
Any forward-looking estimates (e.g., days-to-crisis timelines, demand impact scenarios, stockpile cover periods) represent reasoned, conservative interpretations based solely on the above public data, historical patterns from comparable disruptions, and standard industry benchmarks (such as IEA 90-day net-import rules). These are not forecasts or guarantees and are subject to rapid change based on evolving geopolitical, market, or operational developments.
Boston Warwick makes no representations or warranties, express or implied, as to the accuracy, completeness, or timeliness of the information provided, which is intended for general informational and discussion purposes only and should not be relied upon as the sole basis for commercial, operational, or investment decisions. Clients are encouraged to conduct their own independent verification and consult specialist advisors as appropriate.
Sources in Markdown:
International Energy Agency (IEA) – “IEA Member Countries to Carry Out Largest-Ever Oil Stock Release”, 11 March 2026: https://www.iea.org/news/iea-member-countries-to-carry-out-largest-ever-oil-stock-release-amid-market-disruptions-from-middle-east-conflict
IEA Oil Market Report – March 2026: https://www.iea.org/reports/oil-market-report-march-2026
Argus Media – European Jet Fuel Market Update and Refinery Capacity Report, March 2026: https://www.argusmedia.com/en/news-and-insights/latest-market-news
S&P Global Platts – Jet Fuel Price Surge and Supply Risk Analysis, March 2026: https://www.spglobal.com/commodityinsights/en
Reuters – “Strait of Hormuz Closure Triggers Jet Fuel Shock for European Airlines”, March 2026: https://www.reuters.com/business/energy
Bloomberg – “Airlines Flag Fuel Cost Crisis as Hormuz Disruptions Continue”, March 2026: https://www.bloomberg.com/energy
Kpler – In-Transit Middle Distillates and Jet Fuel Volumes Report, March 2026: https://www.kpler.com/blog
Vortexa – Global Tanker Tracking Analysis, March 2026: https://www.vortexa.com/insights
EUROCONTROL – European Aviation Network Overview, March 2026: https://www.eurocontrol.int
IATA – Monthly Air Passenger Market Analysis (January–February 2026): https://www.iata.org/en/pressroom/
ACI EUROPE – Monthly Airport Passenger Traffic Statistics, March 2026: https://www.aci-europe.org/mediaroom/
European Commission – Statement on Petroleum Stock Levels, 4 March 2026: https://ec.europa.eu/energy